Category:Principal component analysis
Jump to navigation
Jump to search
conversion of a set of observations of possibly correlated variables into a set of values of linearly uncorrelated variables called principal components  | |||||
| Upload media | |||||
| Instance of |
| ||||
|---|---|---|---|---|---|
| Subclass of | |||||
| Has use |
| ||||
| |||||
Subcategories
This category has only the following subcategory.
P
Media in category "Principal component analysis"
The following 63 files are in this category, out of 63 total.
-
 5DFig.png 427 × 592; 3 KB
-
 A method of main is a component.svg 162 × 31; 16 KB
-
 Allvariables.png 2,280 × 1,176; 40 KB
-
 Allvariables.svg 505 × 227; 2 KB
-
 Brassicasterol PCA.png 432 × 400; 9 KB
-
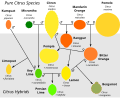 Citrus hybrids.svg 712 × 578; 58 KB
-
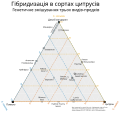 Citrus tern cb simplified 1 uk.svg 823 × 771; 107 KB
-
 Citrus tern cb simplified 1.svg 823 × 771; 126 KB
-
 Citrus tern cb simplified.svg 899 × 911; 121 KB
-
Common-Force-Field-Thermodynamics-of-Cholesterol-207287.f1.ogv 14 s, 720 × 768; 2.39 MB
-
 Contoh Transformasi Balik Analisis Komponen Utama.JPG 557 × 442; 47 KB
-
-
-
-
-
-
 DiscrPca iris01.png 669 × 669; 46 KB
-
 Faktorenanalyse.svg 226 × 240; 4 KB
-

-
 GaussianScatterPCA.png 1,152 × 1,081; 161 KB
-
 GaussianScatterPCA.svg 720 × 720; 515 KB
-
 Genetic diagram of citrus.gif 472 × 491; 65 KB
-
 Gujjar pca.webp 1,245 × 882; 57 KB
-
In-silico-mechanistic-analysis-of-IRF3-inactivation-and-high-risk-HPV-E6-species-dependent-drug-srep13446-s2.ogv 2.4 s, 1,280 × 889; 2.33 MB
-
In-silico-mechanistic-analysis-of-IRF3-inactivation-and-high-risk-HPV-E6-species-dependent-drug-srep13446-s3.ogv 2.4 s, 1,280 × 889; 2.12 MB
-
-
In-silico-mechanistic-analysis-of-IRF3-inactivation-and-high-risk-HPV-E6-species-dependent-drug-srep13446-s5.ogv 2.5 s, 1,335 × 986; 3.36 MB
-
-
 Kernel pca input.png 833 × 666; 8 KB
-
 Kernel pca output gaussian.png 820 × 670; 19 KB
-
 Kernel pca output.png 851 × 637; 7 KB
-
 Kpca-2017.png 2,700 × 1,800; 170 KB
-
 Lang-breit.svg 984 × 1,002; 52 KB
-
 Lang-knoten.svg 984 × 1,002; 54 KB
-
 Matrice delle componenti.JPG 282 × 120; 10 KB
-
 Modern and Ancient populations PCA plot.jpg 1,552 × 982; 568 KB
-
 Movfemale.svg 938 × 563; 150 KB
-
 Movmale.svg 938 × 563; 148 KB
-
 Movtemperature.svg 938 × 563; 103 KB
-
-
 NMF example three factors as RGB.png 512 × 512; 467 KB
-
 NMF example three factors side by side.png 914 × 989; 326 KB
-
 PCA fish.png 970 × 578; 41 KB
-
 PCA gym.png 970 × 578; 54 KB
-
 PCA Inversion.gif 1,855 × 1,056; 8.29 MB
-
 PCA linear end.png 773 × 621; 15 KB
-
 PCA linear start.png 764 × 627; 6 KB
-
 PCA of Haplogroup J from 6 STRs.png 687 × 552; 15 KB
-
 PCA of Haplogroup J using 37 STRs.png 683 × 564; 19 KB
-
 PCA Projection Illustration.gif 640 × 480; 533 KB
-
 PCA warrior.png 532 × 656; 70 KB
-
 Pca-2017.png 2,700 × 1,800; 158 KB
-
 Pca-simulation.png 2,700 × 1,800; 160 KB
-
 PCArys1.JPG 232 × 248; 9 KB
-
 PCS fish ortho.png 1,280 × 709; 123 KB
-
 PearsonFig.jpg 539 × 470; 18 KB
-
 SCREE plot.jpg 624 × 372; 15 KB
-
 Simple Example of Visualization for PCA.jpg 733 × 698; 80 KB
-
-
 SOM versus GSOM.png 1,248 × 859; 145 KB
-
 SOMsPCA.PNG 607 × 400; 26 KB
-
 Totale della varianza spiegata.JPG 612 × 121; 20 KB
-
 Wiki PCA Example Sangdon Lee V2.JPG 682 × 500; 84 KB


